Originally published at braginskyoleg.com.
Data is the major driving factors in the decision-making process whether you are a business owner, the builder of a product or an analyst. With Maksim Golub and founder of School of Troubleshooters Oleg Braginsky we dive deep into the process of building a user’s behavior tracking framework from scratch.
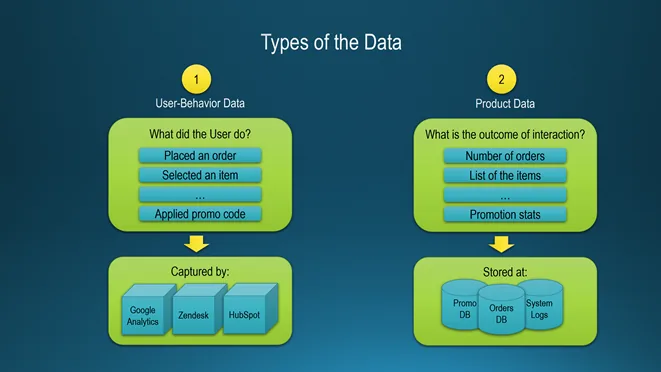
Regardless of your role, there is always need to have an access to data to make decisions on improvements, monitor updates or get a bird view. There are different types of angles to look at the problem: what do the customers do (1) and what is the output of their interaction with the platform (2):
Consider political landscape as well. Different organization structure may reveal a hidden fabrics or small groups that owes certain function or resource and would definitely not want to challenge the status quo. The navigation through these waters is beyond the scope, just make sure to consider it when planning.
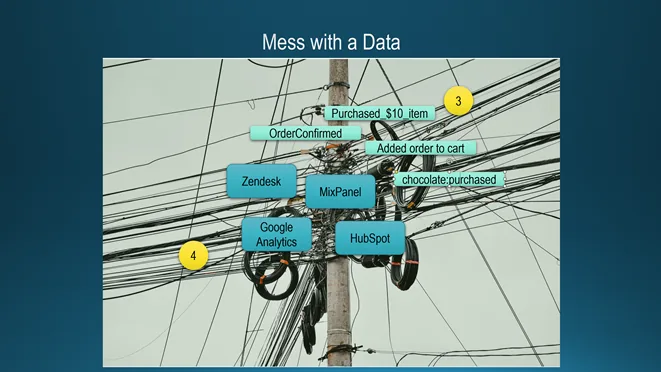
At different stages companies may have certain levels of entropy: not having tracking at all, having it at the basic level adding more platforms and ending up teams using their own vocabularies (3) to describe events, getting mixed up, with collections of tools that organization’s departments starting to adopt (4):
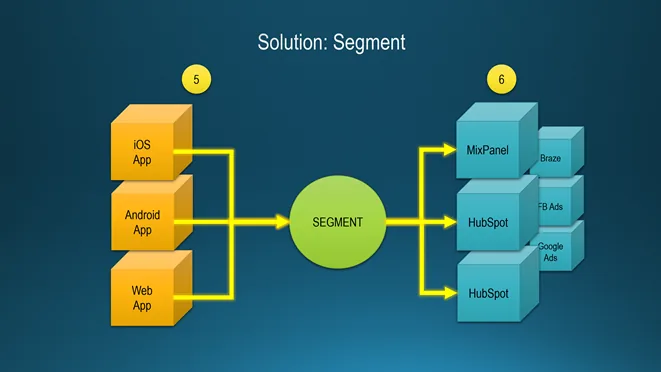
There might be either a boiling point or level of maturity, when either management, product or engineer folks would make a decision to find an ultimate solution to discover services like Segment or mParticle. Put it simple: it’s like a router allowing to plug-in anything (5) and send it to the tool in the right format (6):
The initiation of the project should start with aligning with the stakeholders. In most of the cases it would be CTO or any Data Director of the company. Rarely, CEO might be also involved, if the company is small and resources at scarce. Consider all participants, their hopes, fears, expectations to craft the message.
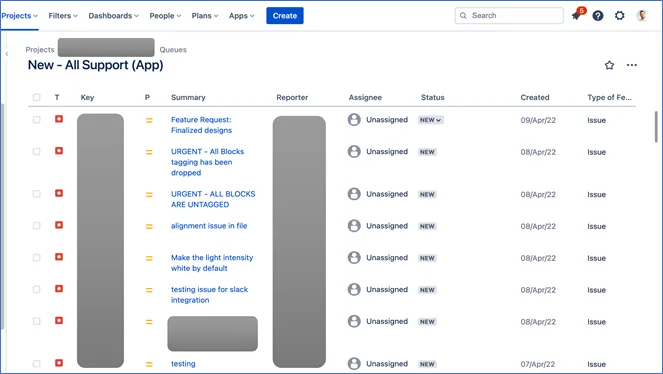
The best way would be to find, validate, and introduce the problem. For example, seeing that there are lot of internal requests to get the data, building a report showing how much time it takes to get it from the backend, what is the idle time of client success, what is the trend, what’s the dollar value is a powerful one.
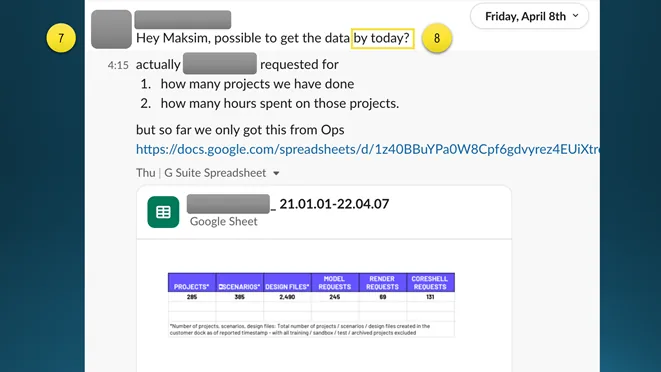
Consider other cases where it may not be possible to get a lot of data from the tracking systems, but you can fetch it from the employees themselves (7). Sometimes it could give more insights in terms (8). Start with the pain points, continue with the value: prepare a case of potential revenue benefit for the company.
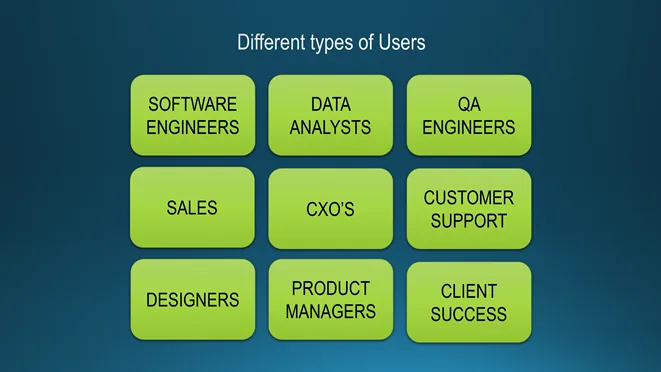
The audience is not the same and should be considered when crafting a message. Start with the high-level and look for support or clear ambiguity with the rest of teams by checking with the heads of the departments for their feedback. Know when to stop, because conducting meetings won’t make an actual progress.
The optimal pass would be to get the buy-in at the highest level, because the company might be focusing on something else and re-allocating resources will affect the deliverables. The second round would be good for tech folk like engineers, product and QA. The last one to be held for the customer-facing audience.
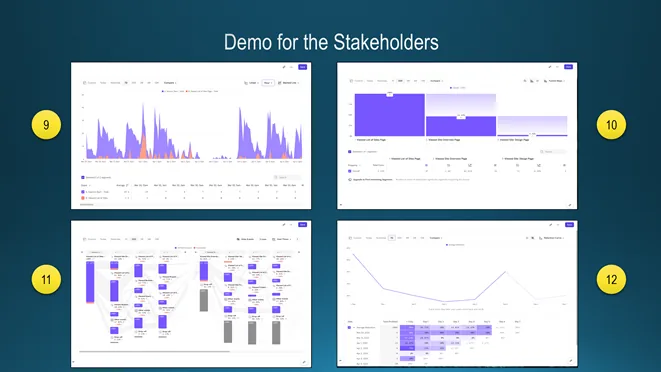
Even if the product is not ready, delight the crowd using 3d party tool and demo events frequency (9), or how the funnels will look like (10). Zoom out for the customer journey (11). Switch the angle to showcase how the retention curve or cohort analysis look (12), break down the information by different parameters.
The beauty of this solution is that it should be done properly once, and after enabling new tools would be a breeze: copy API secret, define the pattern and you can check new marketing tool right after. I’ve seen many times how “integration” projects burnt thousands just to migrate, while it would take a few minutes.
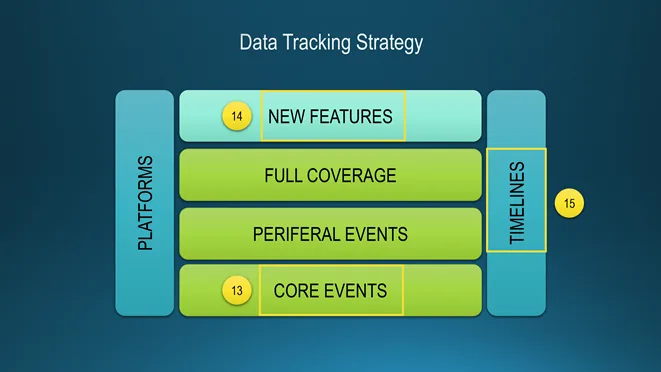
The next steps are to communicate the big picture. Data strategy starts with capturing events reflecting the core business activity (13), making sure that new features will be captured within this framework (14), providing the timelines to the business (15) and mapping out the rest of the components at their own time.
When working with the Segment, you should be mindful about different types of the entities it could track. The actor (16), who uses the platform. The steps at their journey: either web-pages or screens on mobile device (17), and the actual events (18), to capture the activity with extra additional details to get the context.
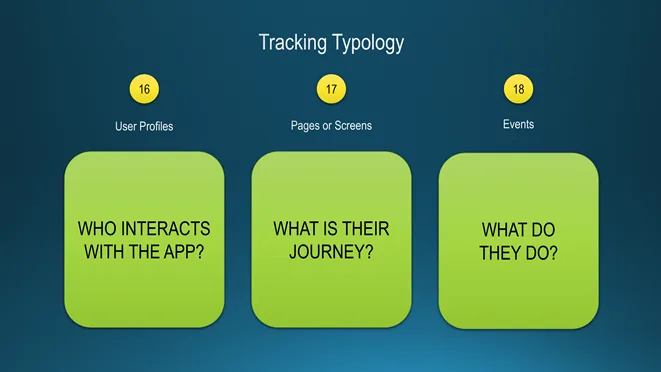
Before diving into the details, ask yourself, what exactly you may want to learn. Then put yourself into shoes of the rest of the team members or stakeholder and ask the same question again. After you have the list, go and speak with the people to make sure to understand their needs to clear the gaps in the plan.
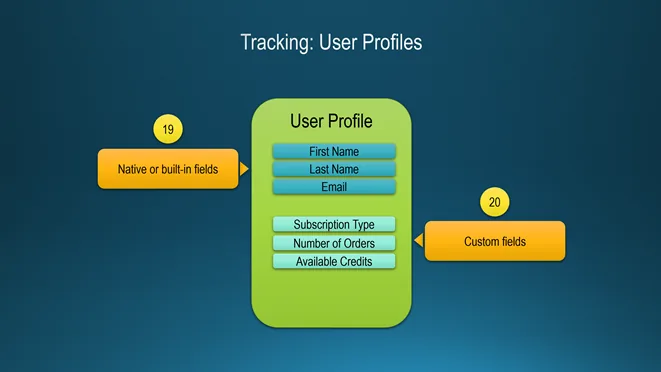
User profile contains all of the information about the consumer. It consists of collection of properties. First part of them are so-called built-in or native fields (19) which include things like name, id, email and so on. The second bunch is what you will add on top of the existing ones, and they are called custom fields (20):
Page reflects the URL that user was viewing or screen that they stayed at. It contains such details as the full link, technical details such as browser name, resolution (21). To understand what brough the user there, use context, set a category, define the state of the view or possible future path they may take (22):
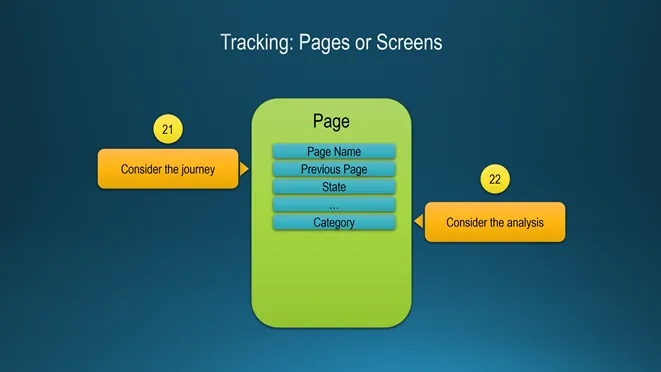
Defining the categories of the page allows to group the data when doing an analysis. For example, you may have a new component, that was released recently. The category may help to see overall performance by similar object and let the analyst to get a bigger picture, spot the difference, dig in to find a root cause.
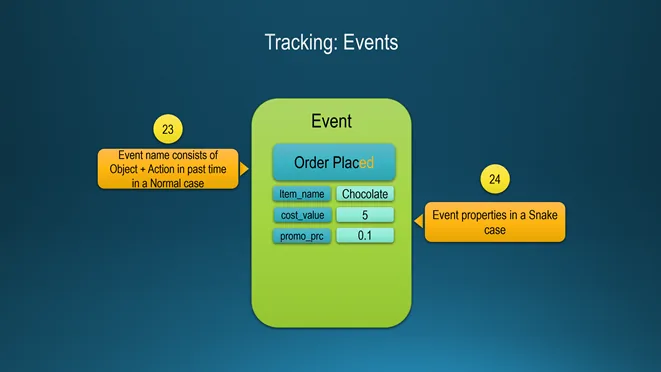
The event consists of few parts: name and properties. For the name it is recommended to use normal case and put the items in the following order: Object + Verb in past time (23). For the properties, the snake case may be suitable. Use them to provide an additional context and details to help with the future analysis (24):
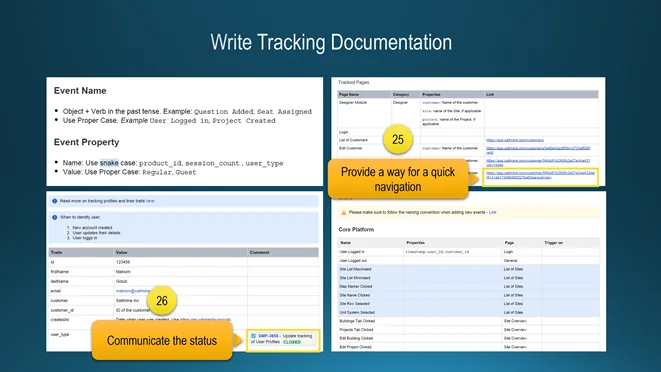
Keep the documentation neat, detailed and up to date to help your team with the implementation (25). Consider adding links to the tickets to let the rest of the group to know the status of tasks and get the sense of progress (26). Make engineers and QA your allies, as it is quite tedious and rarely recognizable work.
Events tracking helps to understand what exactly the user did and what was their environment or context. It is not recommended to track the activities not triggered by user behavior, unless it’s a part of the business logic. For example: developers may decide to track the rendering of certain panels or other UI elements.
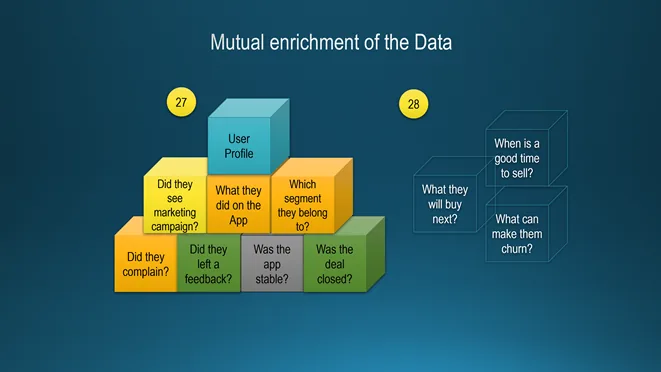
Think and plan for the future improvements. The data might be sent to different sources, but it will open new level of opportunities, if it could reflect all of the aspects of the user journey, process and embed them to their ultimate profile (27) with the ability to answer even more complex questions for the business (28):
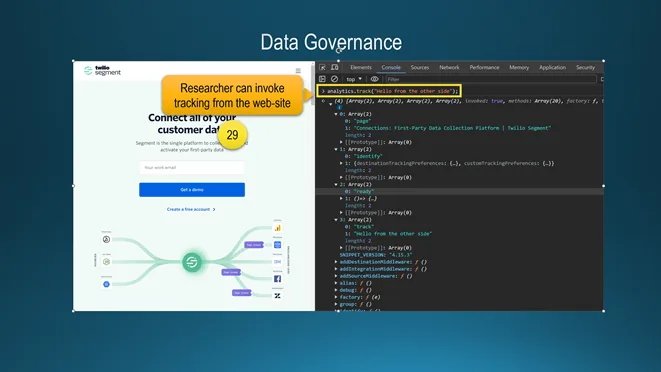
If the company is mature enough, consider the governance of the data to make sure that it won’t be skewed due to the incorrect inputs or someone’s joke (29) when the external party can get an access and create millions of user profiles or events, increasing the bill or decreasing the certainty of data consistency.
The moment work is finished, organize set of internal demos. Technical people will be happy to know they can test and allocate issues faster. Product folks will love the idea seeing how their feature being adopted. Sales and Customer Success team could easily see what is going on with new leads or existing accounts.
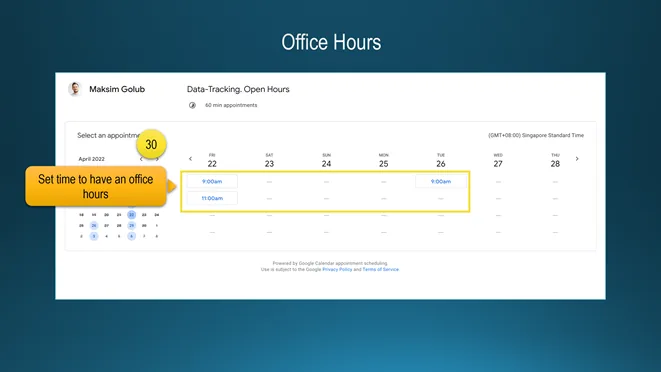
Act as the account manager for your teams by preparing for them relevant dashboards with their key metrics. This will help with the adoption, bring the real value. Create a collaborative environment, where you solve the problem. For the first two months set the office hours to address all incoming questions (30):
Pay attention to your squad who will be helping with the development. You need one engineer for each platform with QA person, backend support to enable certain states to test all of the cases. Educate, help them to acquire and improve knowledge, so they can share it with the rest, or further use in their career.
Do make sure to have an owner of the behavior tracking, so that they can be the gatekeeper when it comes to defining more standards or making sure that anything that is being developed would have a proper tracker installed and tested, so that your team could make the best possible data-driven decisions.